

Executive summary
Modern retail environments cannot operate reliably without dependable connectivity. Card and contactless dominance is now the settled state of UK payments: cards account for just under two thirds of payments, cash sits below a tenth of transactions, and contactless is the default at the checkout. When the connection behind the payment terminal or till fails, a material share of sales may not complete, because cash is no longer a dependable fallback across a card-led estate. The result is that a communications fault can now stop a retailer from trading in ways that were less common a decade ago.
This paper quantifies the cost of a retail payment outage, the revenue a retailer places at risk when connectivity downtime stops checkout activity, and shows how that figure varies sharply by retail format. It then sets out how resilient architecture, built on genuine core diversity rather than a single shared dependency, can reduce revenue exposure and help stores continue trading through an outage.
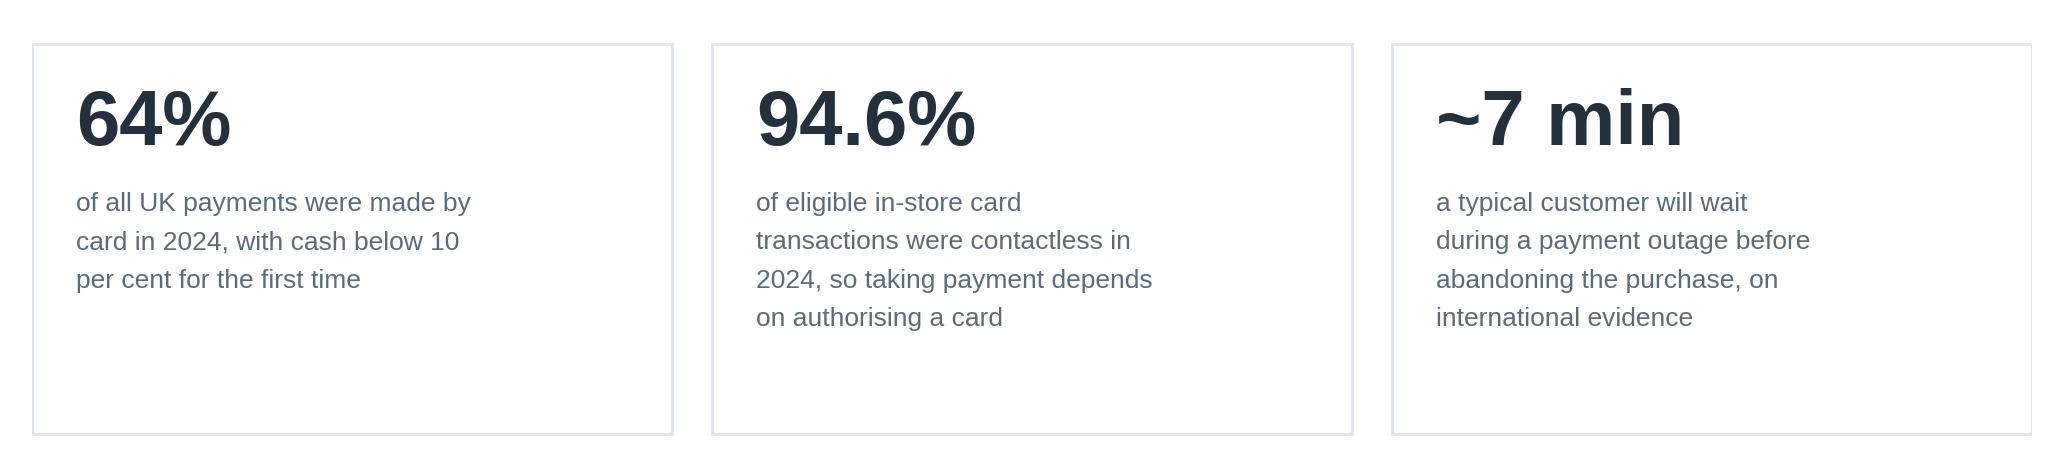
The card and contactless figures are UK-specific, from the most recent full-year UK Finance and Barclays datasets. The abandonment figure, and the other outage-behaviour benchmarks in this paper, are drawn from United States and international studies and are used as directional context; see the methodology and assumptions section in the Appendix.
The central findings are straightforward. Revenue at risk rises with transaction throughput and basket value, so a lost hour at a busy convenience or supermarket checkout costs far more than a lost hour at a less busy one, and a lost hour during peak trading costs more again. The largest single exposures come not from an isolated fault at one store but from correlated outages, where many stores share a dependency such as a payment gateway, an acquiring link, a wide-area network or a processing platform, and are unable to take payment at the same moment.
For the connectivity layer, the mitigation is the same in principle: remove the single shared point of failure, and give each store a way to keep trading when its primary path is unavailable.
What is the cost of a retail payment outage?
The cost of a retail payment outage is the revenue a store cannot take while card and contactless payments cannot be authorised, plus secondary costs such as customer defection, idle labour, incident response and reputational impact. In this model, direct revenue at risk ranges from around £15 per active checkout per hour for unattended units to around £260 for a supermarket or forecourt checkout at peak.
1. Why payment uptime is now a business metric
Card-led payment is now the established pattern in the United Kingdom, and it is what sets the stakes for connectivity in retail systems. In the most recent full-year figures (from 2024), UK-issued cards were used for 31.4 billion transactions, at home and abroad, worth just over a trillion pounds, and cards made up 64 per cent of the 48.8 billion payments made in the UK while cash fell below 10 per cent for the first time1.
In store, contactless is now the default: Barclays also reported that 94.6 per cent of eligible in-store card transactions were made by tapping a card or device in 20242. The pattern has held into 2026: UK Finance’s monthly card spending updates show around two billion card transactions a month in the UK, with contactless accounting for around three quarters of debit card transactions7. A retailer’s ability to take money is, in practice, its ability to authorise a card, and that depends on connectivity.
The consequence is that the old fallback has become less dependable. When card systems were a convenience layered on top of cash, an outage was an inconvenience. Now that cash accounts for fewer than one in ten UK payments, a payment outage stops most sales outright. While these systems rely on many dependencies and moving parts, the effect of system failures is documented. For instance, in March 2024, a cluster of retailers, including a major fast-food chain, two supermarkets and a bakery chain, were unable to take card payments across many sites within a few days of each other, and some outlets temporarily closed or moved to cash only5. The causes were attributed to software updates and third-party systems rather than confirmed as any single failure type, and none was reported as a cyber incident, but the commercial effect was similar in every case: customers could not pay, and sales were lost.
Cash has not disappeared, and it remains important for some consumers, accounting for 4.4 billion UK payments in 20241; the point is that it is no longer a dependable estate-wide fallback for a card-led retail environment, so a payment outage now stops the majority of sales rather than diverting them to notes and coins. Nor is the direction expected to change: UK Finance projects that cards will account for 67 per cent of UK payments by 2034, with cash falling to around 4 per cent1.
Availability of the till is not the same as a completed sale
Retailers tend to monitor whether systems appear to be up and running. Customers experience whether they can pay and leave with their goods. These are not necessarily the same measure, and the gap between them is where the damage sits. For example, a checkout can appear to be working locally or on a system platform, while the path that authorises the payment is failing, so the queue builds, baskets are abandoned and staff are left to apologise.
Because a customer will typically wait only around seven minutes during a payment outage before giving up on the purchase3, even a short disruption at a busy time converts directly into lost baskets and, for a meaningful share of those shoppers, a decision not to come back. Payment reliability is therefore a connectivity question as much as a systems one, and it now sits close to the centre of the customer experience.
This paper concentrates on the economics of connectivity downtime in retail. For the security architecture that protects payment data and store networks, including segmentation and PCI DSS considerations, see CSL’s companion paper, IoT Security Strategies for Retail Store Networks. For a practical guide to selecting connectivity for payment estates, see CSL’s guide to ePOS SIM and rSIM connectivity. Both companion pieces are listed in the references.
2. Where retail connectivity fails
Every modern store depends on a communications layer to operate and trade effectively. That layer carries payment authorisation and settlement, card and mobile wallet workflows, the electronic point of sale (POS) and its back office, stock and pricing updates, click-and-collect and online order fulfilment, and increasingly self-service checkouts, kiosks and digital signage. When the layer is unavailable, a checkout with power and a working card reader may still be unable to authorise a payment, complete a sale or report its status. The hardware on the counter is rarely the weak point; the connection behind it is. POS connectivity downtime, in other words, is usually a network event rather than a device fault, which is why it can stop many terminals, tills or stores at once.
Two kinds of outage, with very different economics
It helps to separate faults into two categories, because they behave differently and call for different mitigations.
- Independent outages affect a single site: a local broadband fault, a failed router, a damaged line or a local configuration error. They are common, usually visible, and their cost is bounded by the takings of one store.
- Correlated outages affect many stores at once because they share a dependency: a payment gateway, an acquiring or processor link, a wide-area network, a cloud region or a certificate authority. They are less frequent, but a single event can stop payments across an entire estate at the same moment.
The previously exampled disruptions from March 2024, while multi-faceted, illustrate correlated retail exposure: several large brands experienced payment or order-processing disruption within a short period5. Four months later the same mechanism was demonstrated at global scale, and this time the shared cause was confirmed: a fault in one routine update to a widely deployed security product disabled an estimated 8.5 million Windows systems within hours, disrupting airlines, healthcare, broadcasters and retailers at the same time, with major UK supermarket and hospitality names among those affected8. The commercial impact of correlated events is disproportionate because losses are multiplied across every affected store simultaneously and often occur during peak trading periods. Industry analysis of payment outages, based on United States and international research, finds that almost two thirds occur during peak trading hours3, when both the volume and the value of lost sales are highest.
An important distinction matters when analysing these events: a shared dependency can sit in the connectivity layer (a common wide-area network or a single mobile network) or in the payment and IT layer above it (a shared gateway, an acquiring or processor link, a cloud region or a common piece of endpoint software, as in July 2024). This paper, and the CSL architecture in Section 6, is about the connectivity layer, removing the network as a shared point of failure, so the March and July 2024 examples are included to show how damaging correlated failure is in principle, not as faults that connectivity resilience alone would have prevented.
THE RISK THAT HIDES IN PLAIN SIGHT
Network availability or coverage is not, in itself, resilience. Many stores rely on a single broadband line, or a single mobile network, for payments, with no independent second path. Where a backup exists, it may not activate autonomously or reliably, and it may still share the same underlying route, core or upstream dependency. In those cases, a single failure can remove both the primary and backup paths. The research behind the outage benchmarks in this paper found that United States businesses in the sector report an average of more than five significant payment disruptions a year, with the average outage lasting around two hours3. For a store that cannot trade without authorising a card, the question to ask is not how fast the primary connection is, but what happens to payments the moment it stops working.
3. Quantifying the cost: a revenue-at-risk model
The direct revenue lost while a store cannot take payment can be modelled simply, and the model is transparent enough to apply to any site:
REVENUE AT RISK
Revenue at risk = transactions per hour × average transaction value (£) × share unable to complete × downtime (hours)
Expressed per active checkout, this reduces to an hourly rate of revenue at risk that depends on how many sales the checkout would have taken and their average value. Throughput and basket size, rather than the number of checkouts alone, drive the figure: a busy convenience till processing many low-value baskets can put more at risk per hour than a less busy checkout handling larger ones. The share that cannot complete is high, because cash now accounts for a small minority of UK payments: with cards at 64 per cent of payments and cash below 10 per cent1, a large part of the revenue during an outage is at risk rather than deferred to a cash sale.
Note: This paper uses an illustrative base-case scenario in which 85 per cent of sales cannot complete during a payment outage, and tests that assumption across a range from 70 to 95 per cent; the effect on revenue at risk is set out in the methodology note. Transaction throughput follows CSL’s connectivity benchmarks and average transaction values follow published UK payments data, with the full assumptions in that same methodology note.
Two adjustments matter when the model is applied across a live retail estate. First, trading is not flat across the day: losses during peak periods are higher than a simple average implies, and outages cluster in those windows3, so an outage that coincides with demand costs more than the headline hourly figure. Second, the model above captures direct sales only. It does not include the secondary costs, customer defection, idle labour, compliance exposure and reputational effects, which Section 5 addresses and which frequently exceed the immediate lost sales.
Figures in this paper are indicative. Actual exposure depends on format, location, throughput, basket value, the payment methods a store can fall back on, and local conditions, so the outputs should be read as directional guidance rather than a guaranteed quantitative prediction or outcome.
4. The cost of downtime by retail format
The cost of a lost trading hour depends on transaction volume, basket value and trading intensity, so the impact varies by retail format. A quieter fashion floor may lose fewer, higher-value baskets, while a busy supermarket or forecourt can see revenue at risk build quickly as many transactions are affected in a short period. The chart below shows indicative revenue at risk per active checkout for each hour of lost payment capability during trading, using the assumptions in the methodology note.
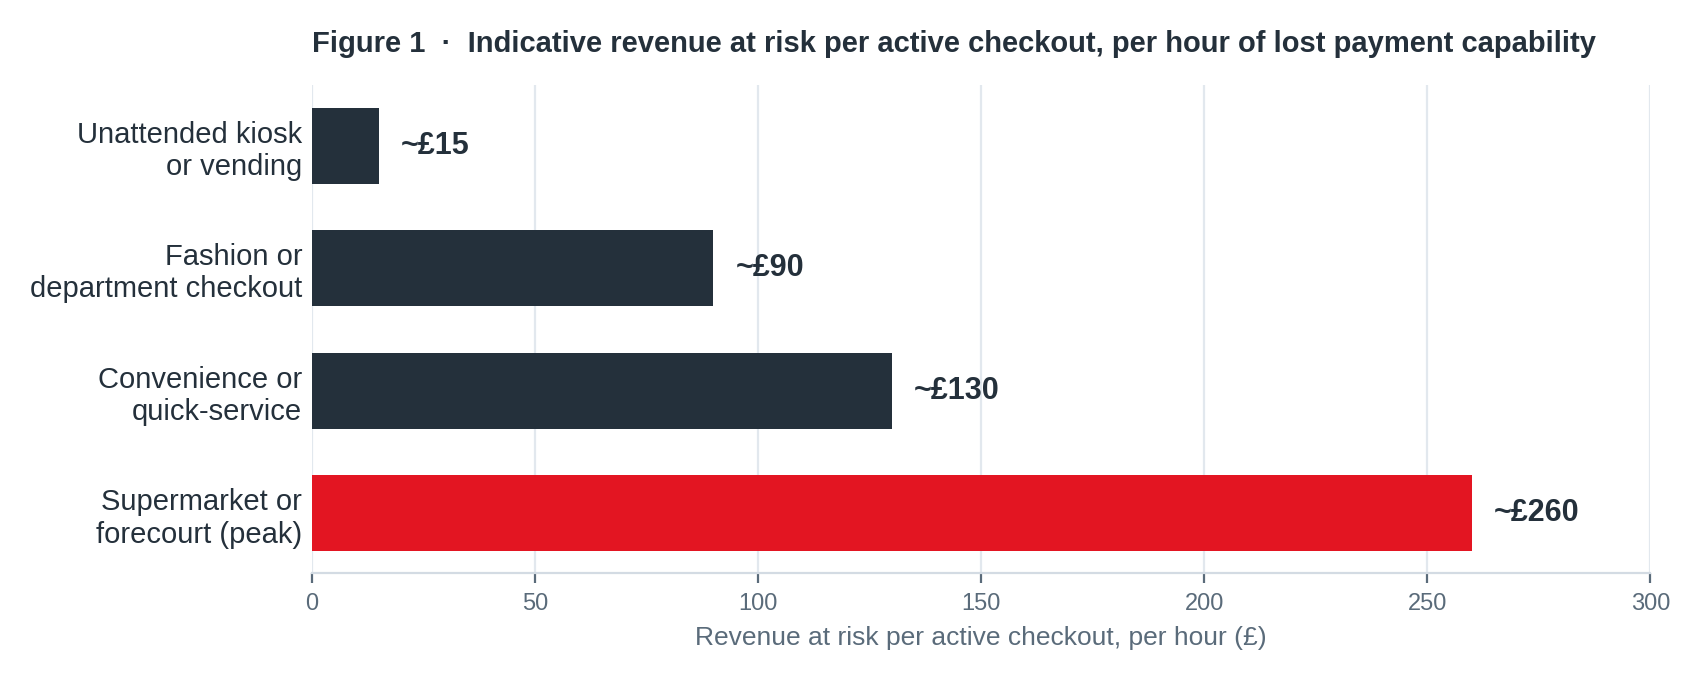
Figure 1. Indicative revenue at risk per active checkout, per hour of lost payment capability during trading. Each bar is the product of transactions per hour, average transaction value and an assumed 85 per cent share of sales unable to complete; the per-format assumptions are set out in Table 3 in the methodology note. A store runs several checkouts, and an estate runs many stores, so store-level and estate-level exposure is a multiple of the per-checkout figure.
Because the model is linear in downtime, the hourly figures scale directly with the length of an incident. Figure 2 applies them across a range of outage durations, anchored on the two-hour average reported in the international research³: over an eight-hour outage, the exposure runs from around £120 at an unattended unit to a little over £2,000 at a peak supermarket or forecourt checkout, per checkout, before store and estate multiples.
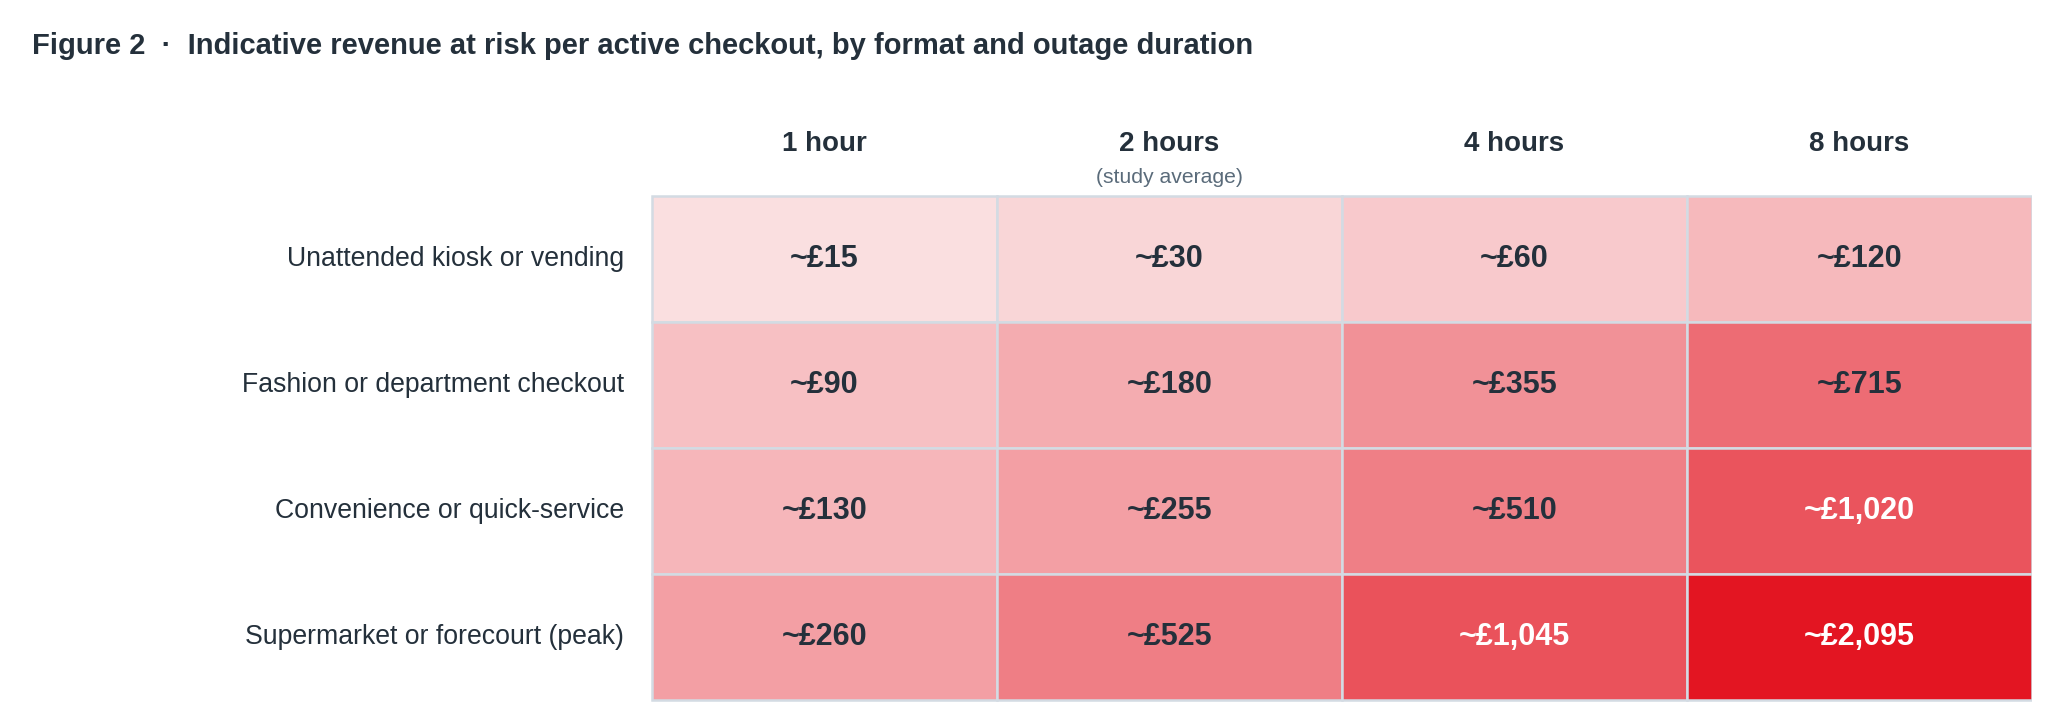
Figure 2. Indicative revenue at risk per active checkout, by format and outage duration. Each cell is the linear product of the Table 3 assumptions at the 85 per cent base case, rounded to the nearest £5; the model contains no volume recovery or escalation over time. Shading is a reading aid only, and every value is shown. A store runs several checkouts, and an estate runs many stores, so store-level and estate-level exposure is a multiple of the per-checkout figure.
WHAT AN OUTAGE LOOKS LIKE AT STORE LEVEL
Convenience store, lunchtime peak. Within a few minutes of the authorisation path stopping, the queue at the till builds, colleagues move from serving customers to managing the disruption, apologising and controlling the queue, and shoppers holding a meal deal and a card set their baskets down and leave. The sales lost in that short window are the ones the store depends on most.
Forecourt, Saturday morning. The same authorisation path sits behind both the pumps and the shop, so when it stops the site cannot take a card for fuel or for the goods inside. A single connectivity fault removes two revenue streams at once, and the forecourt is left managing cash-only trading, restricted service or a temporary suspension of pump activity.
Unattended estate. One kiosk or vending unit puts little at risk per hour, but with no staff on site to step in, the cost becomes the remote diagnosis, the engineering time and the days a unit can sit out of service before it is trading again. Across an estate of hundreds of units, those visits and the lost availability become a material expense.
Convenience and quick-service
High transaction volumes and low-to-moderate basket values mean the revenue at risk per checkout is significant and builds quickly, because a busy till turns over many sales an hour. These formats also trade in concentrated windows, the morning and lunchtime rushes, so an outage that coincides with one of those windows removes a large share of the day’s takings in a short time. The priority is a payment path that keeps working through a local fault, with fast detection so a problem is found before a queue forms.
Supermarket and forecourt
Larger baskets and, at forecourts, fuel sales raise the value at risk per hour, and both formats concentrate demand at predictable peaks. A forecourt that cannot authorise payment cannot dispense fuel against a card, so the loss extends beyond the shop. Supermarkets run many checkouts and self-service lanes from shared infrastructure, so a single connectivity fault can stop several lanes at once; the priority is a design where one such fault cannot take the whole store down. Forecourt payment connectivity is a particular case because the pump and the shop often depend on the same authorisation path; when that path fails, fuel and convenience sales can stop together.
Fashion, department and general merchandise
Lower transaction volumes but higher basket values mean the per-checkout figure is moderate, yet the customer cost is high: a shopper ready to buy a considered, higher-value item who cannot pay is an immediate lost sale and, industry analysis suggests, may be less likely to return4. These stores also depend on connectivity for click-and-collect and endless-aisle ordering, so an outage affects more than the checkout. The priority is continuity of the payment and fulfilment paths, with remote management to resolve faults without a store visit.
Unattended, self-service and kiosks
Vending units, self-service kiosks and unattended payment points carry lower value per unit, but they are often in locations without reliable wired service and with no staff on hand to intervene, so the dominant cost is the engineer visit and the extended time out of service. Because these are frequently the sites where a fixed line is impractical, unavailable or difficult to access, cellular connectivity with an independent fallback and remote diagnostics is the priority, so a unit can recover or be fixed without a physical call-out.
| Retail format | Dominant cost of downtime | Connectivity priority |
| Convenience and quick-service | High-volume lost sales in short peak windows; queue abandonment. | Payment continuity through local and network faults; fast detection. |
| Supermarket and forecourt | High value at risk; several lanes and fuel affected by one fault. | No shared points of failure across lanes, pumps and payment paths. |
| Fashion and department | Higher-value lost baskets; customer defection; fulfilment loss. | Payment and click-and-collect continuity through network resilience, independence and remote diagnostics. |
| Unattended and kiosks | Costly engineer visits; long time out of service. | Cellular with independent, autonomous fallback and remote diagnostics. |
| Multi-store estate with shared dependencies | Every affected store unable to trade at the same moment. | Secure core diversity so one shared network dependency cannot stop the estate. |
Table 1. How the cost and the priority change by retail format.
The final row is where a manageable site-level cost can become a serious estate-level exposure. Applied through the model in this paper, a single store with several active checkouts places several hundred pounds to more than a thousand pounds at risk for each hour it cannot take payment, depending on format and trading period. Multiply that exposure across a chain of several hundred stores, all unable to take payment during a Saturday peak, and a single multi-hour correlated outage can place exposure well into six figures.
To make the scale concrete, a 300-store estate running an illustrative five active checkouts at the supermarket peak rate places around £390,000 at risk for a single peak hour it cannot take payment, and roughly £780,000 across a two-hour outage, on the same per-checkout figures used above. That is the scenario resilient architecture is designed to help mitigate.
5. The full cost of an outage
Direct lost sales are only part of the picture, and often the smaller part. A complete view of downtime cost includes several further categories, each of which can exceed the immediate lost takings for a given event:
- Customer defection. A payment failure is a poor experience at the moment a customer is trying to give a retailer money. It interrupts the purchase at the point of commitment, which can turn an intended sale into an abandoned basket. Industry analysis suggests that payment failures can affect repeat custom, with a share of affected shoppers not returning to the business afterwards4, so the cost of a single outage can extend into future lost visits, not just the baskets abandoned on the day.
- Idle labour. During an outage, staff remain on the clock but cannot serve customers efficiently. The wage cost continues while the revenue stops, and colleagues are diverted into managing queues and apologising rather than selling.
- Compliance and payment-data exposure. Payment traffic must be handled securely in transit, in line with PCI DSS. Ad hoc workarounds during an outage, or an insecure secondary path, can introduce risk precisely when systems are under pressure, which is why the resilience and the security of the connection should be considered together, and why resilience is best designed into a secure retail store network architecture rather than added later as a separate path.
- Contract and concession risk. Concessions, franchises and sites in host locations are increasingly judged on availability, and a poor record can affect renewals and new-site opportunities.
- Reputational effect. A visible payment outage travels, on social media and by word of mouth, and can undermine confidence in the reliability of the in-store experience.
Taken together, these categories mean the true cost of an outage is consistently higher than the direct sales model alone suggests. For financial planning, a retailer can treat the total cost as a multiple of the direct revenue at risk modelled in Section 3. In many estates the total will be materially above the direct figure, but the multiple should be calibrated from the retailer’s own repeat-purchase, staffing and incident-response data rather than taken as a fixed rule. Read this way, the direct model is a conservative baseline rather than a complete estimate, which strengthens the case for investing in network resilience rather than absorbing the risk.
6. Building resilience: the CSL architecture
If the largest exposures come from shared points of failure, the design principle follows directly: remove the single shared dependency while maintaining security, so a store can keep trading and recover when a path fails. Retailers reduce this risk in layers: core independence, so that reaching several networks does not still leave everything routed through one shared core, and, where the stakes justify it, bearer diversity, so that no single connection type is a point of failure. CSL delivers these principles as follows, backed by a fully managed service with monitoring, remote management and 24/7 support.
DualCore®: true core independence
Multi-network DualCore® is the principle at the centre of the architecture: two genuinely independent mobile cores each with local radio diversity, so a failure in one core triggers an automatic switch to the other. This is the practical difference between true core independence and a service that reaches several radio networks but still routes everything through one shared core, where a single core-level failure can stop every device at once.
CSL delivers DualCore two ways. rSIM®, CSL’s resilient SIM, carries two independent operator profiles on a single UICC or eUICC, with the failover logic resident on the SIM itself, so a payment device can move to its alternative profile on its own, without waiting for an instruction from a management platform that may be unreachable during the very outage it needs to resolve. Because it needs no CSL firmware in the device, rSIM suits payment terminals, self-service kiosks and unattended units.
For the store network itself, CSL IoT Routers apply the same DualCore switching in firmware, with remote management. In each case, and where the device, bearer paths and payment workflow support it, a checkout or an unattended unit can support continued card authorisation through a network fault without a manual intervention or an engineer visit. This can be implemented via broadband combined with cellular failover, or alternatively as a full DualCore cellular-only architecture for maximum flexibility.
CSL Outpost: multi-bearer resilience
For the sites and estates where the stakes justify more than cellular resilience alone, CSL Outpost combines multiple independent bearers into a single managed stack. It is a fully managed unit with up to four independent 4G or 5G modems or paths, bonded with fibre and LEO satellite, under software-defined orchestration with automatic failover, so the loss of one bearer is less likely to interrupt service. It can be deployed without relying on a fixed-line connection, and follows a layered approach: a primary active path, with alternate, contingency and emergency layers behind it, so a store has an alternative working path available when its primary line is down.
Where POS workflows and acquirer rules support offline or store-and-forward operation, resilient connectivity of this kind can help maintain trading continuity through an outage. The rationale for combining fixed line, cellular and satellite into a single managed path is set out in CSL’s article on layered multi-bearer resilience.
Matching architecture to retail format
The right level of resilience is, therefore, the one proportionate to the cost of not trading, not simply the one with the fastest primary connection.
| Format | Connectivity priority | Recommended CSL approach |
| Single independent store | Keep taking payment through a local fault. | Managed IoT SIM with rSIM for autonomous failover, plus monitoring. |
| Convenience and quick-service | Continuity through peak windows; fast detection. | rSIM for DualCore failover, with wired primary and payment path monitoring. |
| Supermarket and forecourt | No shared points of failure across lanes and fuel. | CSL Routers, stepping up to CSL Outpost for multi-bearer resilience where required. |
| Fashion and department | Payment and fulfilment continuity; remote fix. | rSIM DualCore cellular with private APN/VPN and remote diagnostics; CSL Routers or CSL Outpost where store architecture requires a managed edge device or multi-bearer resilience. |
| Unattended and kiosks | Remote fix; an independent fallback path. | rSIM multi-network DualCore or CSL Routers, with remote diagnostics. |
Table 2. Recommended CSL starting point by retail format.
A note on this paper’s scope: This section summarises the CSL approach to helping retailers keep stores operating and trading. The security design that protects payment data and store networks, including segmentation, private APN and VPN routing and PCI DSS considerations, is set out in full in the companion paper, IoT Security Strategies for Retail Store Networks.
7. Measuring what customers actually experience
Retailers should measure resilience by what happens when something fails, not only by whether individual devices appear to be available. The most useful measures are those that show whether customers can still complete payment, whether failover happened automatically, and whether a fault was contained to one site or spread across multiple terminals and stores.
Alongside device and line availability, retailers should track payment authorisation success rate, time to detect and repair faults, the number of failover events, and whether those events were handled automatically. They should also monitor how many terminals and stores are affected by shared-dependency failures. That measure is easy to overlook, but it is often the most consequential because it captures the correlated events that drive the largest single losses. Measured in this way, resilience becomes something a retailer can manage in real time, rather than a figure reviewed only after an incident.
8. Conclusion and next steps
Retail payment resilience is no longer a technical or supplier preference. It has become a condition of trading. When a store cannot authorise a card, the point is not simply that a connection has failed; the store has lost part of its ability to take payment. That exposure rises in peak periods, multiplies across shared dependencies, and becomes most serious when many devices or sites rely on the same underlying path.
The evidence in this paper is consistent. Cash is no longer a dependable estate-wide fallback for a card-led environment, the cost of an outage rises with throughput and basket value, and the largest single losses come from correlated failures that stop many stores at once. The response is equally clear. It is not to buy the fastest primary connection and assume it will hold, nor to treat network coverage as resilience. It is to design out the single shared dependency: for some estates, autonomous SIM-resident failover with genuine core diversity; for others, managed routers and layered bearer options. The right architecture is the one proportionate to the value of continued trading, not simply the one with the fastest headline connection.
CSL designs connectivity for retail as managed business-critical infrastructure, from managed ePOS SIM and rSIM connectivity for point of sale to a fully layered stack for the estates that need it. To size the right architecture for your stores, and to model the retail payment outage cost across your own estate using the approach set out here, contact the CSL team at csl-group.com/contact-us.
Why CSL?
CSL is a critical-connectivity specialist with roots in alarm signalling, where missed signals can carry serious life-safety or operational consequences, and it applies that discipline to payment systems. The company manages critical connectivity for over 3.5 million connections across life-, mission- and business-critical estates, including retail and hospitality environments, supporting point of sale, self-service kiosks and customer touchpoints, which is the same resilience challenge described in this paper.
The same connectivity discipline is visible in live retail deployments: for example, in the Dual-Stream case study, where CSL provided secure, isolated connectivity across a national retail estate, kept separate from the retailer’s core systems, which is the kind of managed, sector-aware delivery a payment estate also relies on.
Appendix: Methodology and assumptions
The revenue-at-risk figures in this paper are illustrative and are intended to show relative scale between retail formats, not to predict the exposure of any specific site. They are produced with the model set out in Section 3: revenue at risk equals transactions per hour multiplied by average transaction value, the share of sales that cannot complete, and downtime hours.
The per-checkout hourly figures in Figure 1 are built from three inputs for each format: the number of transactions an active checkout would take in an hour, the average transaction value, and the share of those sales that cannot complete during a payment outage. Figure 2 then applies the same hourly figures across different outage durations using the same linear model, with no assumed volume recovery or escalation over time.
Average transaction values are anchored to published UK payments data, where the average contactless transaction was in the region of £16 in 20242, with convenience and quick-service baskets below that level and supermarket, forecourt and considered-purchase baskets above it. Transaction throughput follows CSL’s connectivity benchmarks for point of sale. The base case assumes 85 per cent of sales cannot complete, reflecting card and contactless dominance and the decline of cash as a fallback. Table 3 sets out the assumptions behind each bar in Figure 1; figures are rounded to the nearest £5.
| Retail format | Transactions per checkout per hour | Average transaction value | Share unable to complete | Revenue at risk per hour |
| Unattended, self-service or kiosk | 4 | £4.50 | 85% | ~£15 |
| Fashion or department | 5 | £21 | 85% | ~£90 |
| Convenience or quick-service | 15 | £10 | 85% | ~£130 |
| Supermarket or forecourt (peak) | 14 | £22 | 85% | ~£260 |
Table 3. Assumptions behind Figure 1. Revenue at risk per active checkout, per hour, at the 85 per cent base case.
Because revenue at risk moves in direct proportion to the share unable to complete, the base case can be read against a lower and an upper bound. Table 4 applies a 70 to 95 per cent range to two representative formats; a share appropriate to a specific estate can be substituted, since the output scales linearly with it.
| Share unable to complete | Convenience or quick-service | Supermarket or forecourt (peak) |
| 70% (lower bound) | ~£105 | ~£215 |
| 85% (base case) | ~£130 | ~£260 |
| 95% (upper bound) | ~£145 | ~£295 |
Table 4. Sensitivity of revenue at risk to the share of sales unable to complete, per active checkout, per hour.
Outage frequency, duration and the concentration of outages in peak trading windows draw on published payment-outage analysis.
The outage-behaviour figures cited from external studies, including the aggregate annual sales exposure6, the frequency and duration of outages, the share of outages in peak hours and the typical wait before a customer abandons a purchase, are drawn from published retail and payments research, several sources of which are based on United States and international data. They are used here as directional context and framed for a UK audience; they should be read as indicative rather than as UK-specific measurements. Actual exposure depends on format, location, throughput, basket value, fallback payment methods and local conditions. CSL can apply the model to a specific estate to produce site-level figures for evaluation.
Common questions on retail payment outages
What is the cost of a retail payment outage?
It is the revenue a store cannot take while it is unable to authorise card and contactless payments, plus the costs that follow. This paper models the direct revenue at risk per active checkout per hour, from around £15 at an unattended kiosk to around £260 at a busy supermarket or forecourt checkout at peak. The full cost is higher once customer defection, idle labour, incident response and reputational effects are included, and the largest single losses come from correlated outages that stop many stores at once.
How do you calculate POS downtime cost?
The model is deliberately simple: revenue at risk equals transactions per hour, multiplied by the average transaction value, the share of sales that cannot complete, and the downtime in hours. This paper uses an illustrative base case in which 85 per cent of sales cannot complete during a payment outage, and tests that across a range from 70 to 95 per cent. A store runs several checkouts and an estate runs many stores, so store-level and estate-level exposure is a multiple of the per-checkout figure.
Why does retail connectivity downtime affect revenue?
Because most payments depend on a live connection, and have for some years. In the most recent full-year figures, cards accounted for 64 per cent of UK payments in 2024, cash fell below a tenth of transactions, and 94.6 per cent of eligible in-store card transactions were contactless, so a checkout that cannot reach its payment path cannot complete most sales. With cash no longer a dependable estate-wide fallback, a communications fault now stops trading in a way it did not a decade ago.
How can rSIM reduce payment outage risk?
rSIM provides autonomous, SIM-resident failover between mobile networks, so a point-of-sale device can move to a working network without waiting for an instruction from a management platform. That removes the single-network dependency behind many payment outages. For estates that need more, it can sit within a layered stack alongside genuine core diversity, managed routers and additional bearers such as fixed line and satellite.
What is the difference between coverage and resilience?
Coverage is whether a connection is available in normal conditions; resilience is whether payments keep working when the primary path stops. A store can have strong coverage from a single network or line and still lose the ability to trade the moment that path fails, especially where a backup shares the same underlying route or core. Resilience means designing out the single shared point of failure, so that a fault in one path does not stop the store.
References and further reading
- UK Finance: UK Payment Markets 2025 (published October 2025, covering 2024) for the 64 per cent card share of payments, the fall of cash to 9 per cent, 4.4 billion cash payments and the 48.8 billion payment total; and the UK Finance press release £1 trillion worth of UK card transactions in 2024 for the 31.4 billion transactions on UK-issued cards, at home and abroad, worth just over £1 trillion. A free summary of the Payment Markets report is published by UK Finance; the full report is available to members or for purchase.
- Barclays Consumer Spend, contactless spending in 2024: the record 94.6 per cent share of eligible in-store card transactions made using contactless, and an average contactless purchase of £16.10. UK Finance (reference 1) separately reports 18.9 billion contactless transactions in 2024 at an average of £15.86.
- Payments Dive, on the Dynatrace, FreedomPay and Retail Economics payment-outage study: annual sales exposure, outage frequency and average duration, concentration of outages in peak hours, and the typical time before customers abandon a purchase.
- Industry analysis of POS downtime (a secondary vendor source citing a Visa merchant study and Gartner retail data): used only as directional context for the effect of payment failures on repeat custom. The underlying primary figures were not independently verified and are not relied on as a headline statistic.
- CIO, Payment-processing outages at UK retailers (March 2024): the cluster of UK retail payment outages, their attributed causes, and the reliance on shared payment systems.
- FreedomPay, Dynatrace and Retail Economics, payment-outage study announcement (January 2026): the primary release behind reference 3, reporting $44.4 billion of United States retail and hospitality sales at risk each year, an average of more than five significant disruptions per business per year, and 63 per cent of outages in peak trading periods. United States data, used as directional context.
- UK Finance, Card Spending Update, March 2026 (published June 2026): the most recent monthly card activity data for the UK, including total transaction volumes and the contactless share of debit and credit card transactions.
- Computer Weekly, CrowdStrike update chaos explained (July 2024): the 19 July 2024 global outage caused by a faulty security-software update, the estimate of around 8.5 million affected Windows devices, and the organisations affected across sectors, including UK retail, leisure and hospitality names. Cited as a cross-sector illustration of a single shared software dependency.
Further CSL reading:
- The security architecture companion, IoT Security Strategies for Retail Store Networks;
- The connectivity selection guide, ePOS SIM Cards and rSIM Connectivity;
- The resilience white paper Building IoT Resilience: Multi-Network and Multi-Link Connectivity;
- The CSL Retail and Hospitality sector overview;
- The broader explainer The Cost of Connectivity Downtime and How to Stop Paying It;
- and, on connectivity trends, Five Trends Shaping Critical IoT Connectivity in 2026.
CSL retail white paper: The Cost of Connectivity Downtime in Retail. Version 2.1, July 2026. Payment-behaviour framing and data currency refreshed against the latest UK Finance releases. UK payment-behaviour figures are sourced to UK Finance and Barclays. The revenue-at-risk figures are illustrative and show relative scale between formats rather than the exposure of any specific site, and several outage-behaviour benchmarks are drawn from United States and international studies and used as directional context.