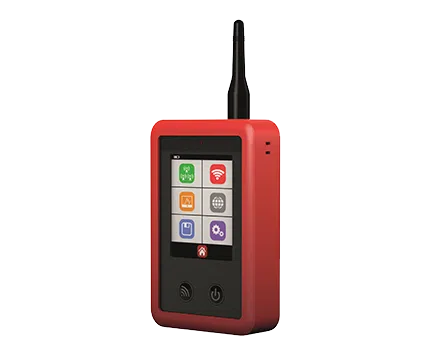
Introduction
Enabling
Site Survey (Radio)
 and press Go
  .
. .
. for the survey to begin. If you wish to name the survey before you start select the Name Survey Icon , name your survey
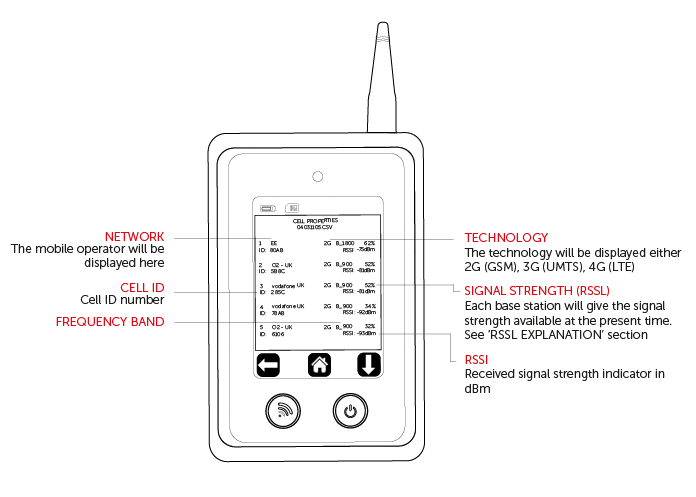
 Survey Results (Radio)
Site Survey (Wi-Fi)

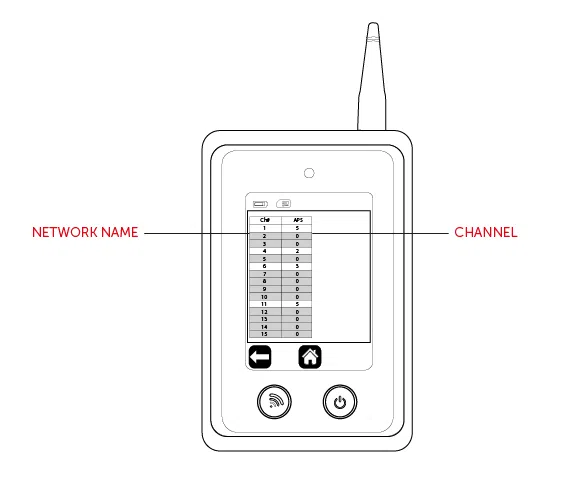
Survey Results (Wi-Fi)
Monitor Mode (Radio)
 .
. .
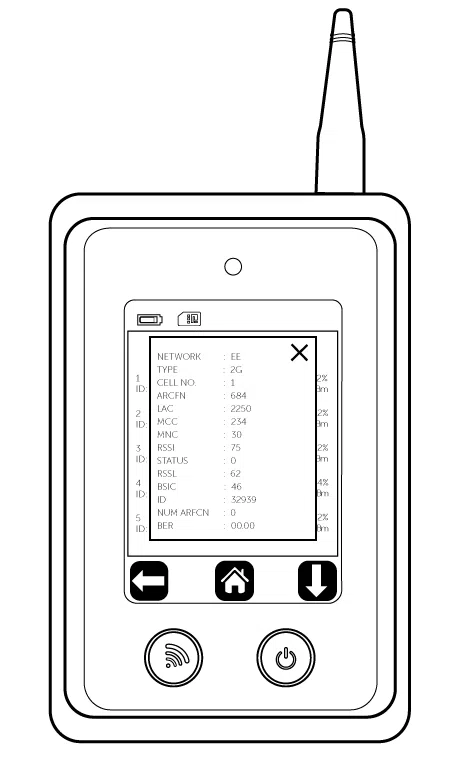
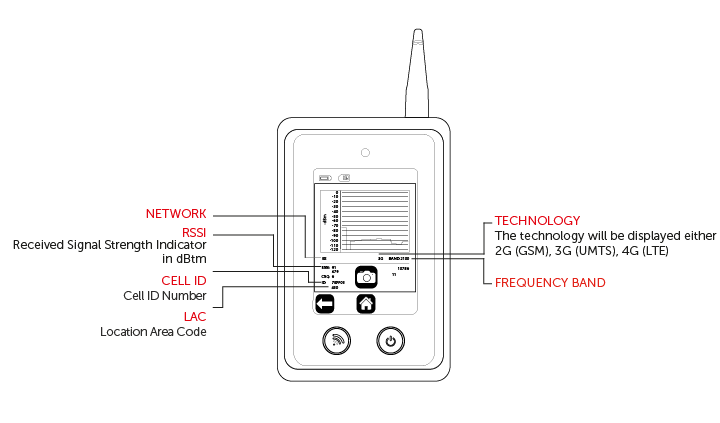
.Monitor Mode Result (Radio)

Monitor Mode (Wi-Fi)


 and it will constantly signal Google to provide you with ping times in ms
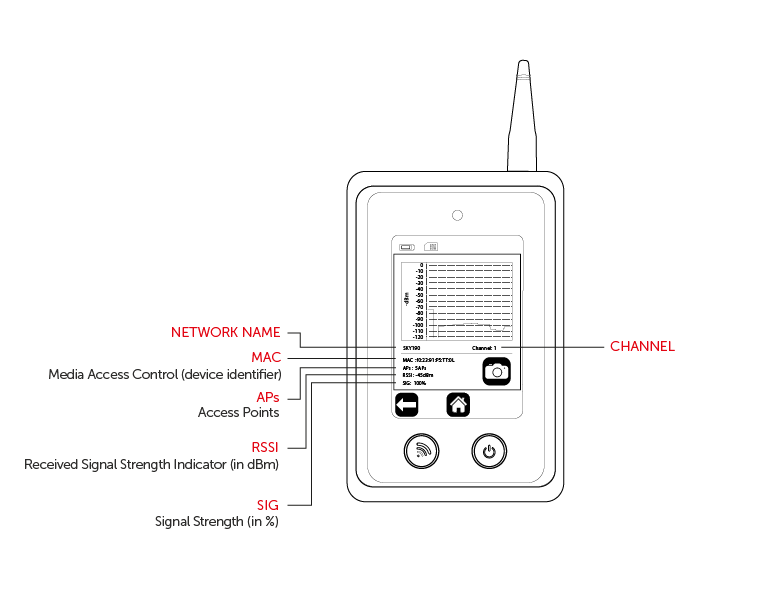
Monitor Mode Results (Wi Fi)
Saved Files
 will now show in the top right-hand corner.
Settings


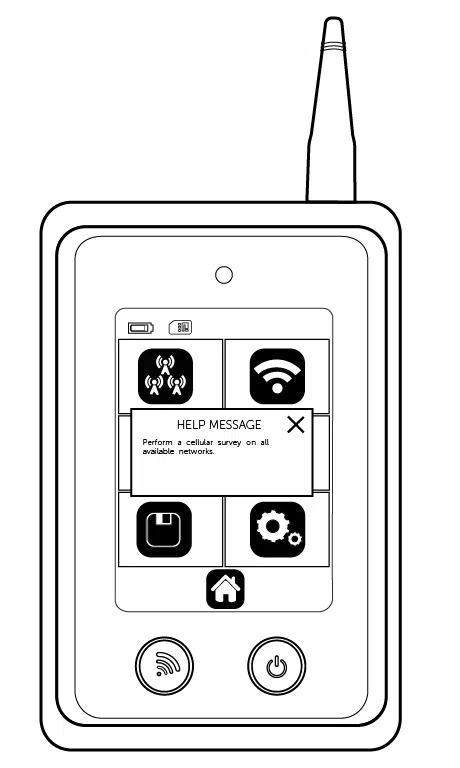
Technical Specifications
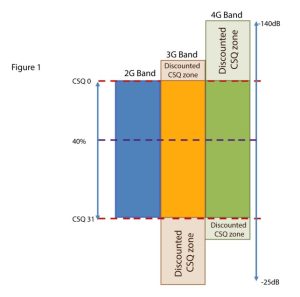
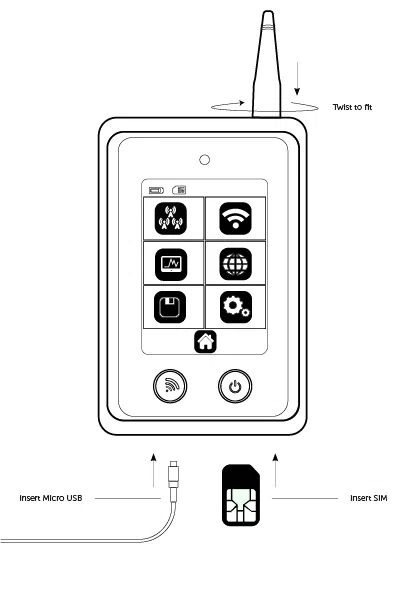
Figure 1 – Signal Analyser Diagram
RSSL EXPLANATION
To ensure that a consistent approach is used for all Radio Access Technologies (RAT) – such as 2G, 3G and 4G – a new, more accurate method for calculating the percentage of the signal strength has been introduced. The RSSL is not based on CSQ readings alone provided by the radio module but is calculated from the raw data received from the network readings. The value is mapped through the whole range and is consistent across each RAT. The value calculation includes both signal strength and signal quality measurements.
An example of such mapping for a 3G cell is:
RSCP: -80 dBm
RSRQ: -4 dB
CSQ: 19
ECIO: 12
SPECIFICATIONS
| Model | CS2389 2G/GSM, 3G/UMTS, 4G/LTE |
| Dimensions | 172mm (h) x 72mm (w) x 20mm (d) |
| Weight | 149g including aerial |
| Temperature | -20°C to + 60°C transit, -4°C to +40°C operating |
| Humidity | 0-80% non-condensing |
| Warranty | 2 years |
| Radio Technology | GSM, UMTS, LTE, Wi-Fi 2.4Ghz (depending on version) |
| Battery | 3.7 Volt 1500mAh |
| Charger | 5 Vdc micro USB plug-top charger or equivalent |
FREQUENCY BAND
| Part Number | CS2389 |
| 4G Bands (MHz) | 2100 (B1) 1900 (B2) 1800 (B3) 1700 (B4) 850 (B5) 2600 (B7) 900 (B8) 700 (B12) 700 (B13) 700 (B14) 850 (B18) 1900 (B25) 850 (B26) 850 (B19) 800 (B20) 700 (B28) |
| 3G Bands (MHz) | 2100 (B1) 1900 (B2) 1700 (B4) 850 (B5) 850 (B6) 900 (B8) 850 (B19) |
| 2G Bands (MHz) | 1900 (B2) 1800 (B3) 850 (B5) 900 (B8) |
| Wi-Fi | 2.4Ghz |
CERTIFICATIONS
International Radio Approval
The CS2389 Signal Analyser incorporates an independently tested and approved 4G/3G/2G radio module that meets the requirements of European radio communication standards
Approval Authority: 0063